Linux system tools
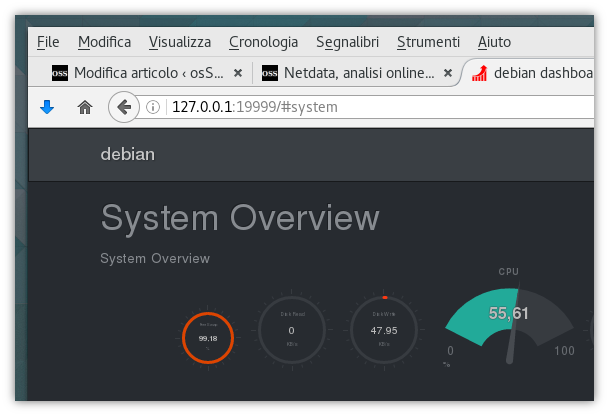
netdata è un interessante tool che mette a disposizione una dettagliatissima analisi in tempo reale del proprio sistema interamente consultabile dal browser.
E’ sufficiente avviare il demone e collegarsi al suo indirizzo per accedere a molteplici informazioni organizzate in modo piacevole e suddivise in categorie senza installare applicazioni che lavorano su interfacce esterne.
Queste sono le cose che è possibile monitorare con netdata:
CPU usage, interrupts, softirqs and frequency (total and per core)
RAM, swap and kernel memory usage (including KSM and kernel memory deduper)
Disk I/O (per disk: bandwidth, operations, backlog, utilization, etc)
sda
Network interfaces (per interface: bandwidth, packets, errors, drops, etc)
dsl0
IPv4 networking (bandwidth, packets, errors, fragments, tcp: connections, packets, errors, handshake, udp: packets, errors, broadcast: bandwidth, packets, multicast: bandwidth, packets)
IPv6 networking (bandwidth, packets, errors, fragments, ECT, udp: packets, errors, udplite: packets, errors, broadcast: bandwidth, multicast: bandwidth, packets, icmp: messages, errors, echos, router, neighbor, MLDv2, group membership, break down by type)
netfilter / iptables Linux firewall (connections, connection tracker events, errors,etc)
Processes (running, blocked, forks, active, etc)
Entropy
NFS file servers, v2, v3, v4 (I/O, cache, read ahead, RPC calls)
Network QoS (yes, the only tool that visualizes network tc classes in realtime)
qos-tc-classes
Applications, by grouping the process tree (CPU, memory, disk reads, disk writes, swap, threads, pipes, sockets, etc)
apps
Apache web server mod-status (v2.2, v2.4)
Nginx web server stub-status
mySQL databases (multiple servers, each showing: bandwidth, queries/s, handlers, locks, issues, tmp operations, connections, binlog metrics, threads, innodb metrics, etc)
ISC Bind name server (multiple servers, each showing: clients, requests, queries, updates, failures and several per view metrics)
Postfix email server message queue (entries, size)
Squid proxy server (clients bandwidth and requests, servers bandwidth and requests)
Hardware sensors (temperature, voltage, fans, power, humidity, etc)
NUT UPSes (load, charge, battery voltage, temperature, utility metrics, output metrics)
Installare netdata su Linux (testato su Debian):
Installare le dipendenze necessarie:
# apt-get install zlib1g-dev gcc make git autoconf autogen automake pkg-config
Scaricare e installare netdata:
$ git clone https://github.com/firehol/netdata.git --depth=1
$ cd netdata
$ su
# ./netdata-installer.sh
Avviare netdata:
Avviare il demone:
Alla prima installazione l’installer lo lancerà in automatico, le volte successive sarà sufficiente lanciare l’eseguibile /usr/sbin/netdata da root mentre per chiuderlo il comando è
# killall netdata
.
Visualizzare i dati:
Aprire il browser all’indirizzo:
http://127.0.0.1:19999/
La configurazione avviene tramite il file
/etc/netdata/netdata.conf
e può essere mostrata online dall’indirizzo http://127.0.0.1:19999/netdata.conf.
E’ possibile avviare netdata in automatico al boot aggiungendo /usr/sbin/netdata a /etc/rc.local.
Screenshots:
[nggallery id=108]
Leave a Reply